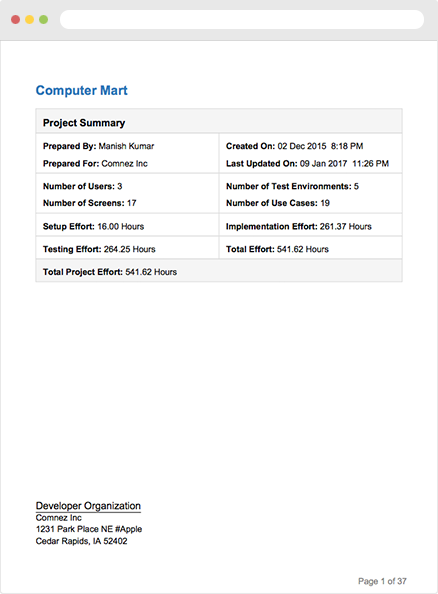
The first page of the estimation document contains some important numbers that can be used to get a good idea in terms of the feasibility of the proposed estimate. Some of the elements of this overview are the number of users, use cases, screens and test environments.
The project summary also shows a high level breakdown of the different types of effort such as setup, implementation and testing.
These numbers can be used to draw a relationship between the cost and the depth of analysis that was performed to calculate the cost of the project.
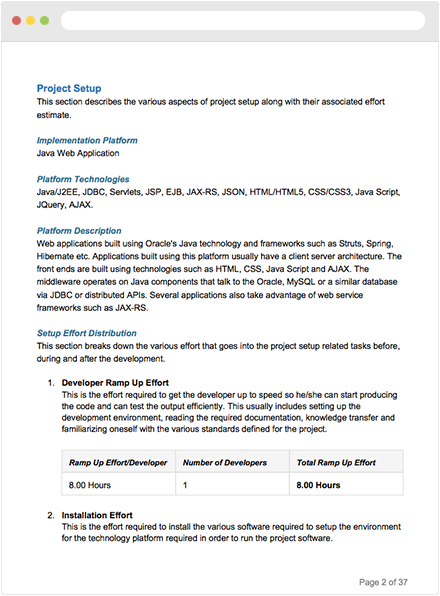
The effort required to get the developers started on a project.
This refers to the common software installations that will be used by the project.
The effort required to setup the project repository and associated branches is covered by this parameter.
Many projects utilize build scripts to manage deployments. The effort required to create these scripts is a part of the project setup effort.
The effort required to deploy the project in various environments.
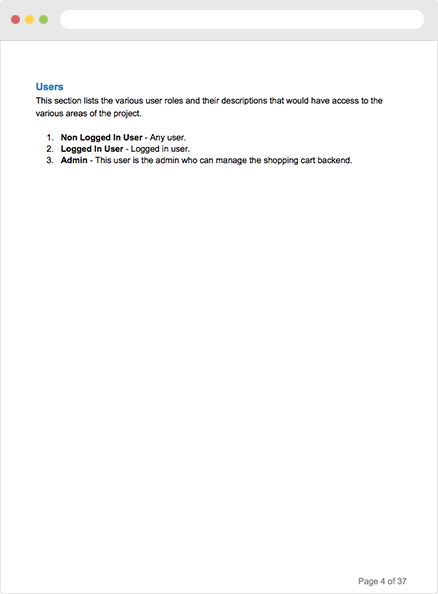
For example, if you are developing a leave management system for an organization then you will have employees who would have access to the leave application and the status of their application, whereas the managers and HR personnel will have access to a different set of functions to review and approve/reject the leave applications.
It is important to identify all the user roles or the users who would have access to the different areas of the software.
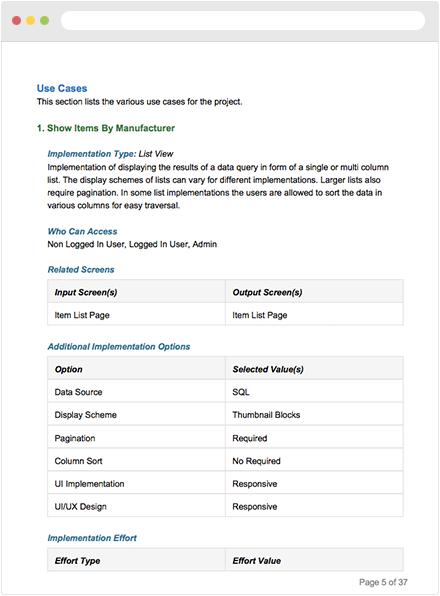
The action is defined by a complete input/output cycle performed by the software. The task of identifying the use cases is usually performed by an experienced business analyst. A good example of one of the most common use cases is user login where the user enters the login credentials and submits the data to get authenticated by the system.
The different metrics associated with each use case are:
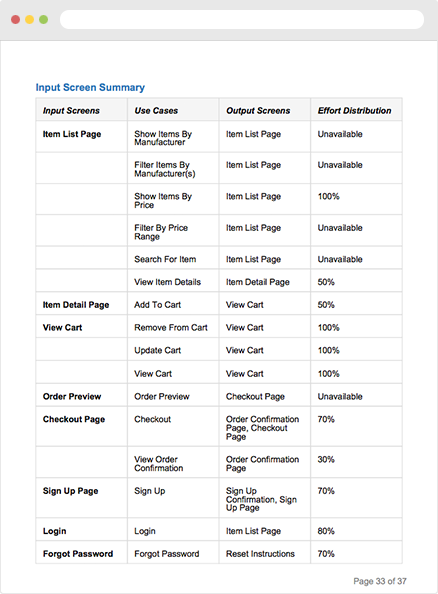
There is an optional attribute called "Effort Distribution" against each use case in this section. The purpose of this optional attribute is to show the effort distribution for a use case towards the screens affected by the respective use case.
For example if user login involves two screens such as login and dashboard, and the effort distribution is 80-20 then we can safely assume that 80% of our effort will go towards the implementation of login screen for this implementation versus 20% towards displaying the dashboard.
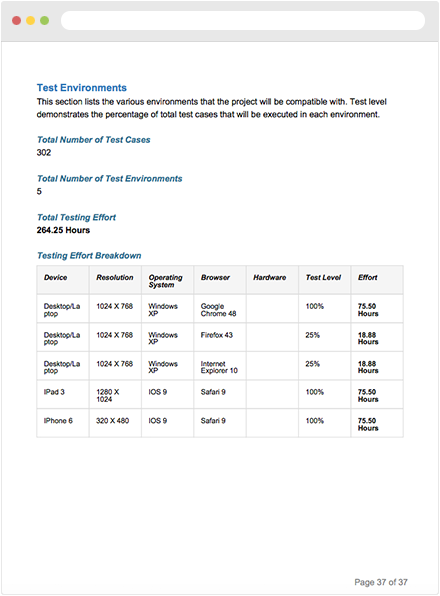
The development company must develop and execute a large set of test cases in different environments to ensure that the product will function well in these environments.
Quick FPA calculates the testing effort for a project by taking the number of estimated test cases for each implementation into consideration.
The total number of test cases is the sum of all the estimated number of test cases and also includes the number of validation test cases which is calculated automatically depending on the data fields that need to be validated for each use case.